Archive of posts with tag 'Data Visualization'
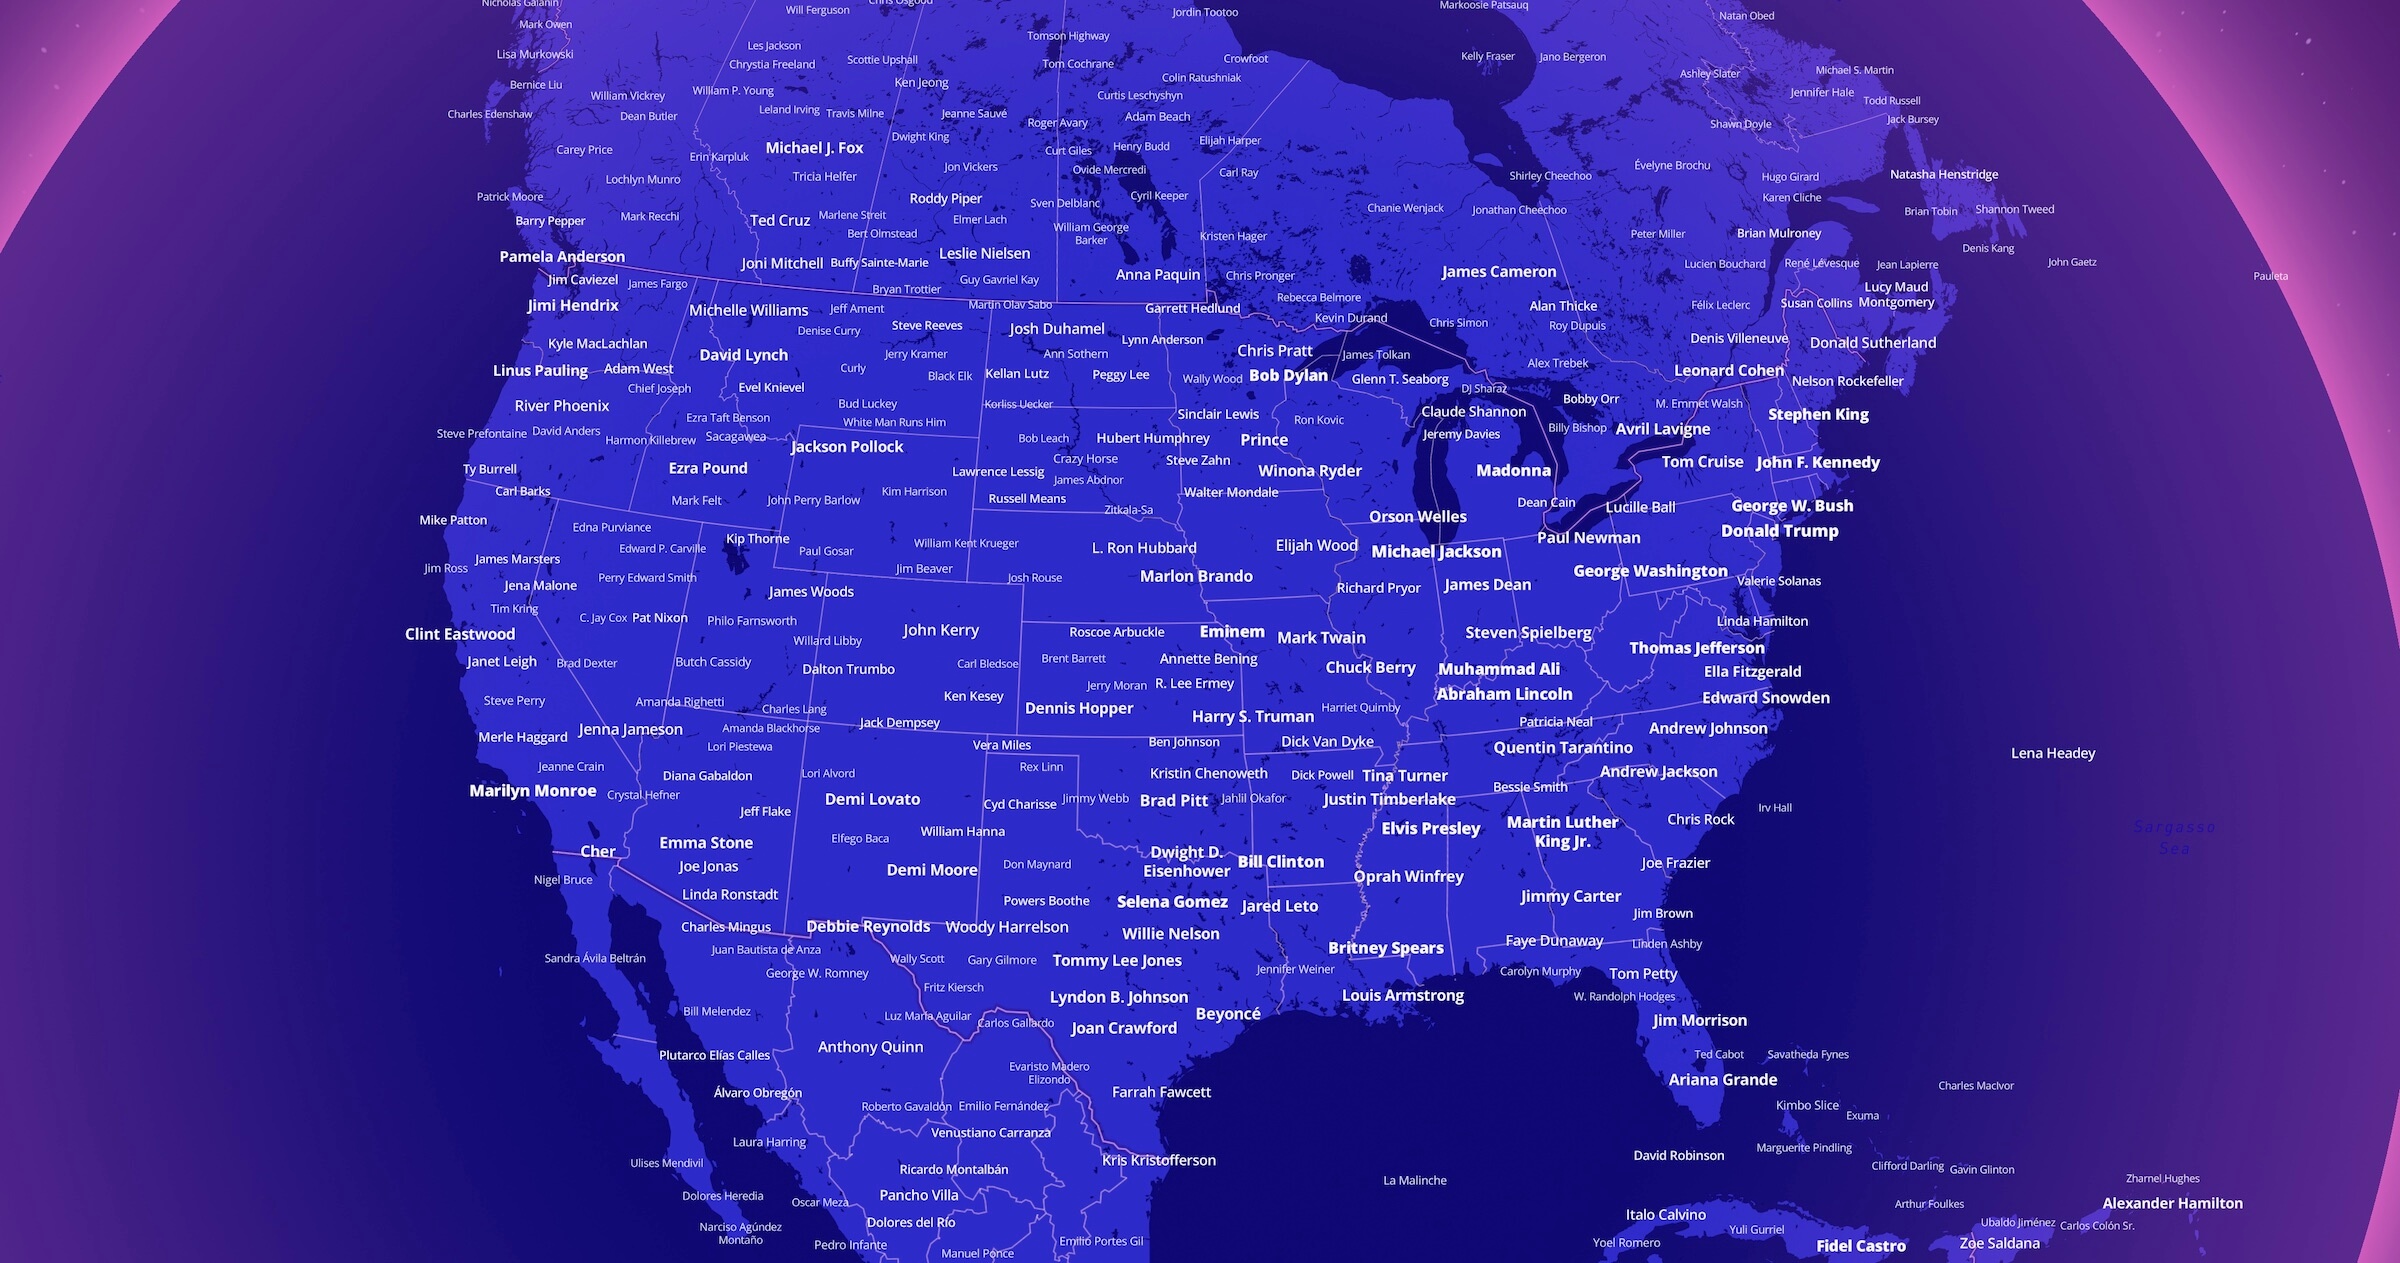
Map of Notable People →
August 15, 2022 • #One of the neatest data visualization projects I’ve seen lately is Topi Tjukanov’s “Map of Notable People.” It takes a database of birthplaces of notable people and maps them to cities on a global interactive map. Surprisingly addictive to pan around.

Mermaid Diagrams →
July 12, 2020 • #Mermaid is a neat project to add a custom syntax layer in Markdown to support rendering diagrams like flowcharts and sequences.
Roam just recently added support for Mermaid in Roam graphs, which renders your diagram live as you edit the markup in a page. This is useful for adding visuals to pages, but I’ll have to mess around and learn its syntax to get comfortable.
A Peek Into Netflix Queues →
January 5, 2010 • #A New York Times visualization of most-queued films by US zip code. A cool example of what can be done with 100% free data. The queue data is accessible through Netflix’s API and zip code boundaries from the US Census.