July 18, 2023 • #
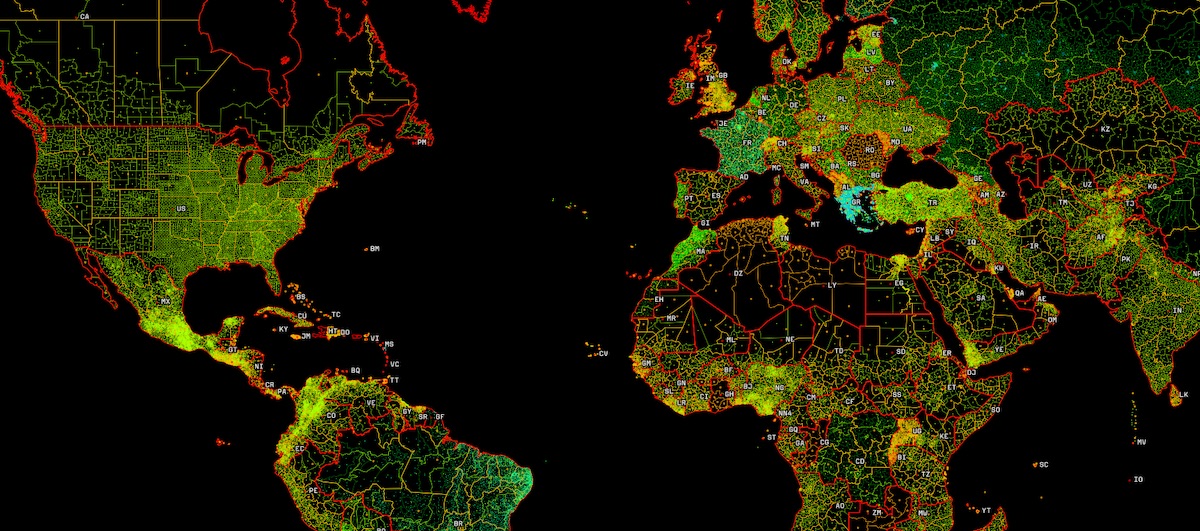
Google has released a massive dataset of building footprints, extracted from high resolution satellite imagery:
The dataset contains 1.8 billion building detections, across an inference area of 58M km2 within Africa, South Asia, South-East Asia, Latin America and the Caribbean.

1.8 billion features is enormous, and it doesn’t even cover North America, Western Europe, most of China, Japan, or Australia. Incredible stuff, licensed under CC-BY-4 and ODbL.
✦
April 26, 2020 • #
Since the beginning of 2019 I’ve been tracking ongoing goals using a Google Sheet I made, where I can enter each activity day by day and generate a rollup showing how I’m tracking on each goal throughout the course of the year.
Andy Matuschak put it well in this post where he talked about his system for habit-building. A calendar week isn’t great for tracking overall progress because it’s artificially-constrained.
Let’s take my current goal of running 650 miles this year. That averages to doing 12.47 miles per week to hit the number. With something like running,...
✦
April 25, 2020 • #
Benedict Evans looks at what could return to normal after coronavirus, and what else might have accelerated change that was already happening.
“Every time we get a new kind of tool, we start by making the new thing fit the existing ways that we work, but then, over time, we change the work to fit the new tool. You’re used to making your metrics dashboard in PowerPoint, and then the cloud comes along and you can make it in Google Docs and everyone always has the latest version....
✦
March 21, 2020 • #
Tom MacWright on chess. Reduce distraction, increase concentration
Once you have concentration, you realize that there’s another layer: rigor. It’s checking the timer, checking for threats, checking for any of a litany of potential mistakes you might be about to make, a smorgasbord of straightforward opportunities you might miss. Simple rules are easy to forget when you’re feeling the rush of an advantage. But they never become less important.
Might start giving chess a try just to see how I do. Haven’t played in years, but I’m curious.
March 6, 2020 • #
Since I began tracking my reading habits a year and a half ago, I’ve been able to keep up with it regularly. It lives in a Google Sheet and allows me to log dates I started and finished books, attributes about them, ratings, links, and more.
I spent some time with Airtable importing and cleaning up the data so I could have a richer version with the ability to view, edit, and add to the library from my phone. Airtable has the ability to create Views (similar to what we do with Views in Fulcrum) which are essentially...
✦
February 22, 2020 • #
This is a product from Loveland Technologies, with a cohesive dataset of parcel boundaries provided as an API for application builders.
More on their parcel data and how they do it here.
My goal tracking efforts pale in comparison to what Julian Lehr is doing. I might give a try to Airtable for mine, also. I’ve been in Google Sheets since mine’s pretty basic, but AT might make it more mobile-friendly for editing.
January 27, 2020 • #
Tom posted a while back about his book review section, and adding schema.org microdata to those pages for book review-related data. The promise of these schema standards is to provide a semantic markup framework for unstructured text content, so things like recipes, movies, and products can conform to an attribute standard for (theoretically) better indexing and search.
Referencing his implementation, I went through my library templates and added schema attributes on the relevant properties I publish. I don’t know what value those’ll have, but...
✦
January 9, 2020 • #
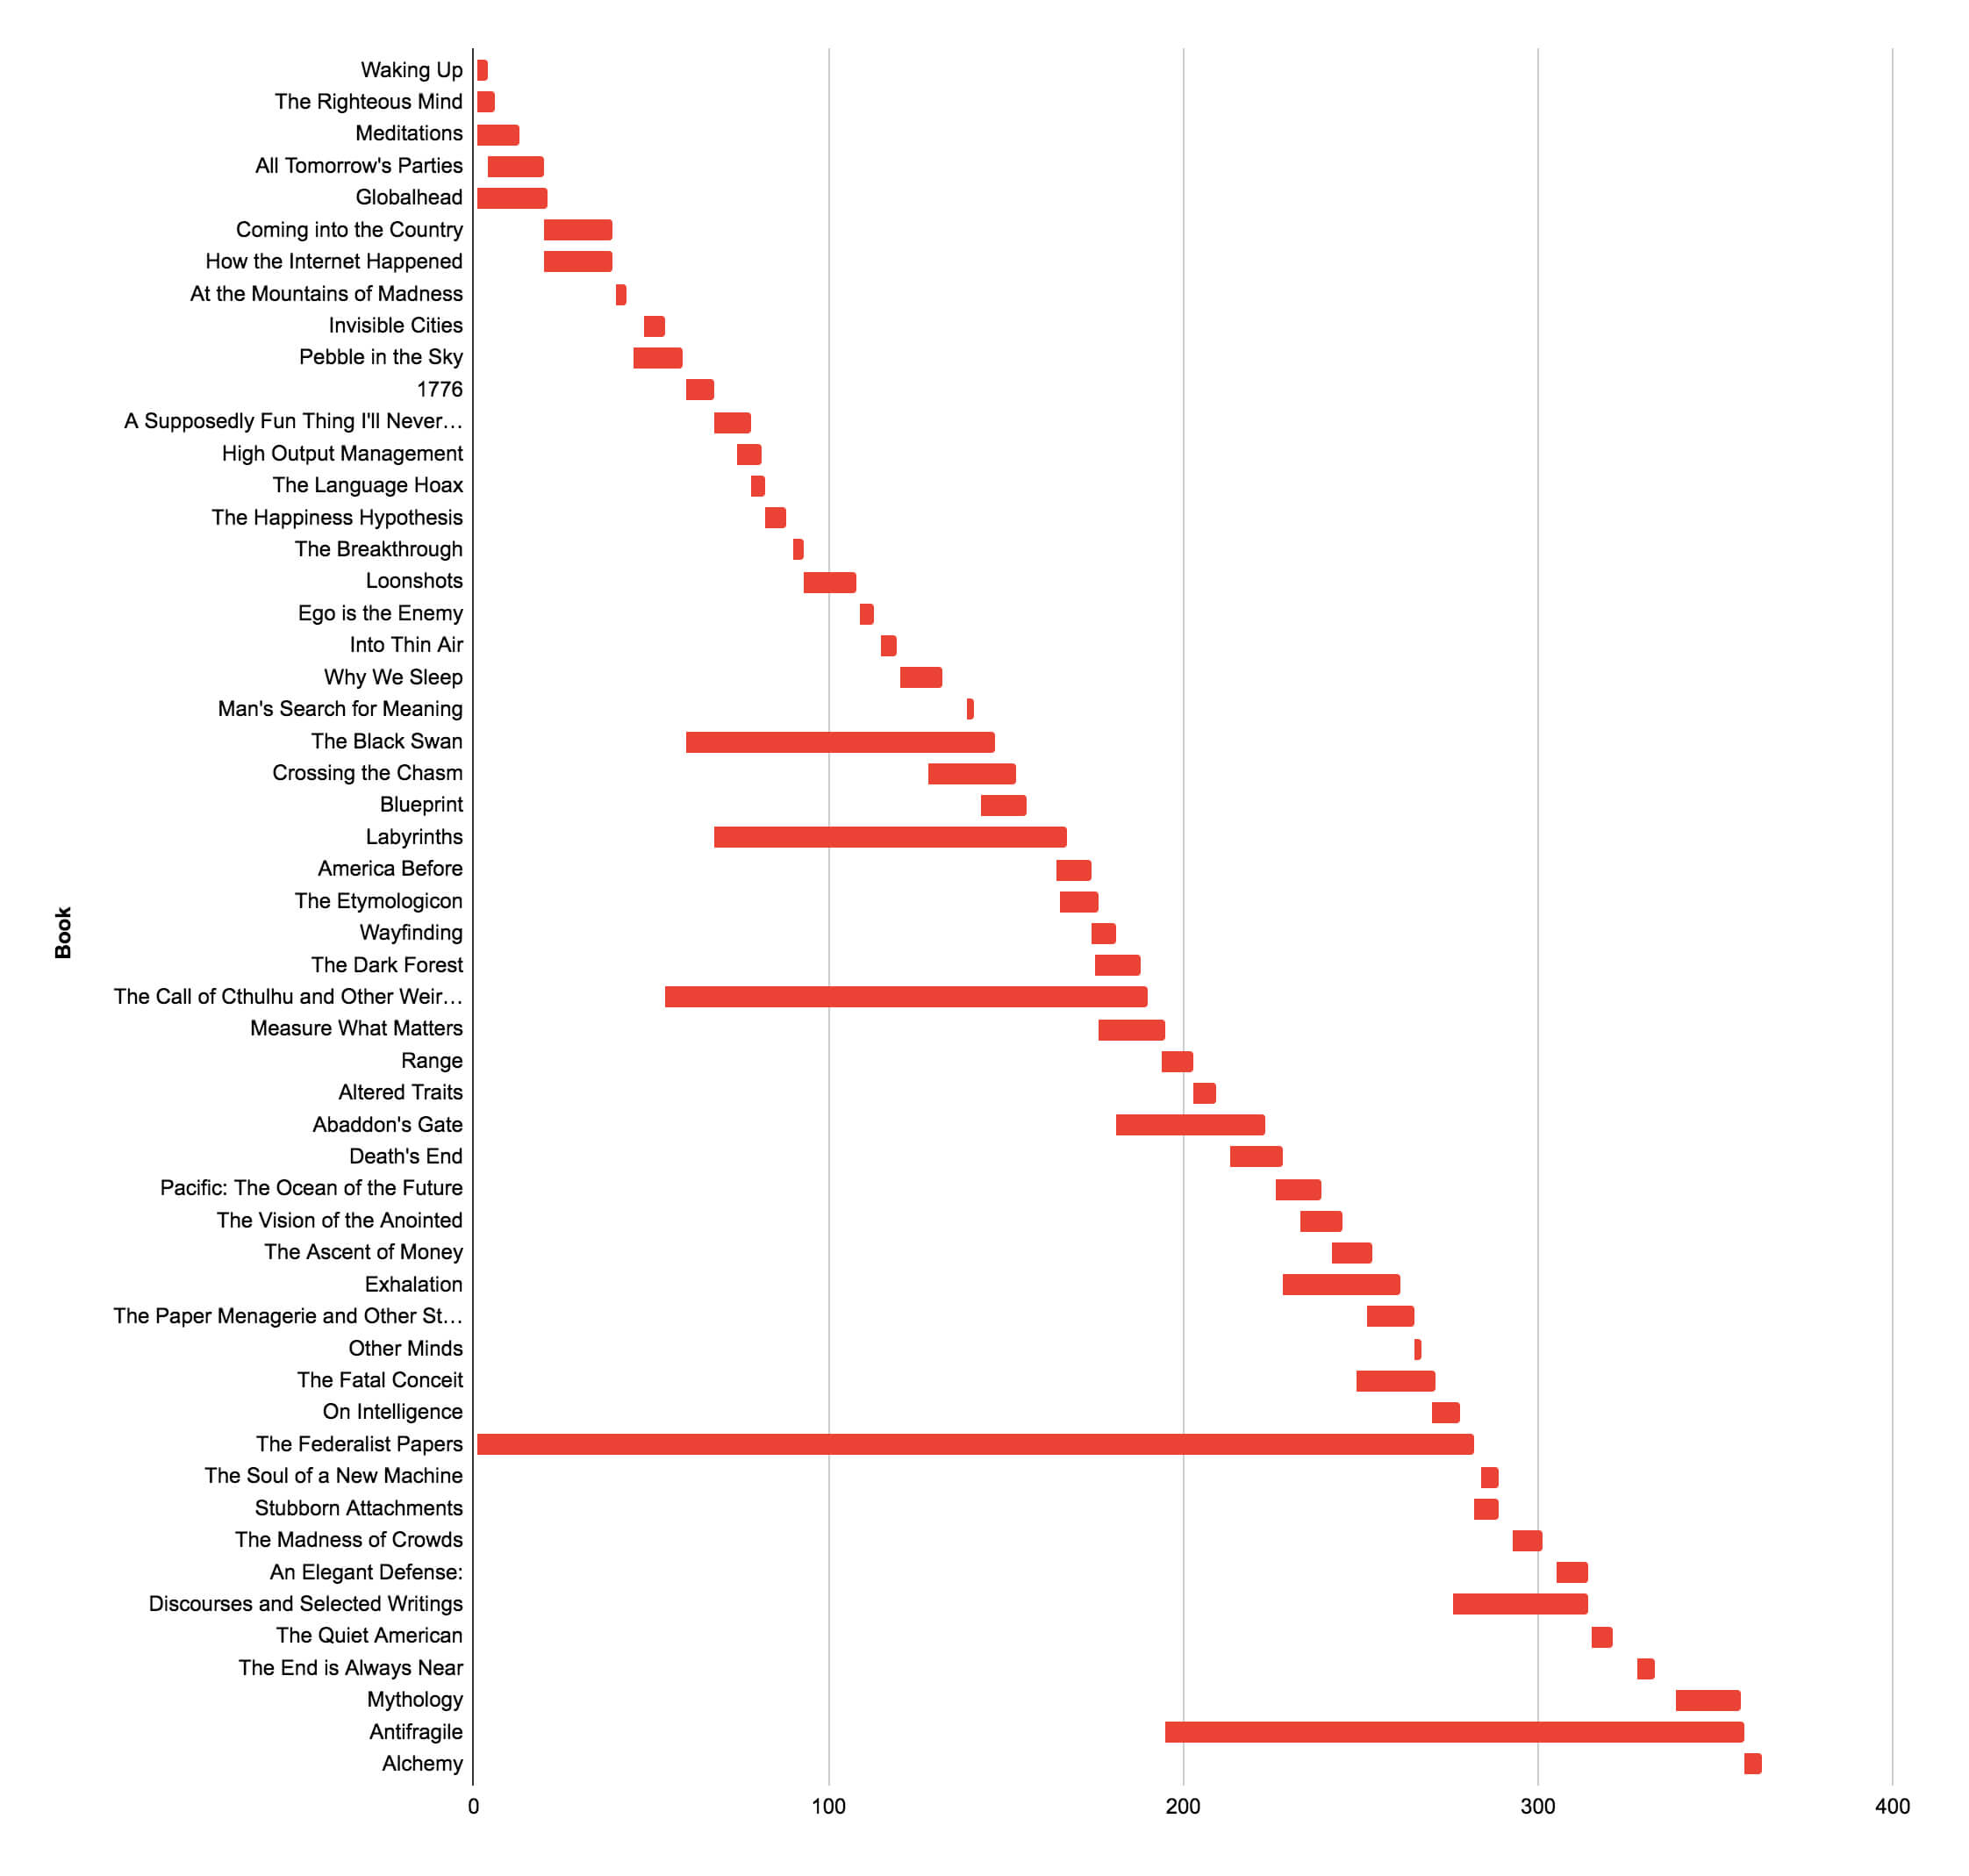
Since I began tracking my books in a spreadsheet in 2018, I’ve got a bunch of data I can now look at on my reading habits.
One thing I took a stab at was a “duration chart” that could show the reading patterns over time, based on when I started and finished each book.

Using this stacked bar chart style, you can see which books I stalled out on and put down for long periods. Not a judgment on those books’ respective merits, more of a criticism of...
✦
October 12, 2019 • #
An amazing feat:
On a misty Saturday morning in Vienna, on a course specially chosen for speed, in an athletic spectacle of historic proportions, Eliud Kipchoge of Kenya ran 26.2 miles in a once-inconceivable time of 1 hour 59 minutes 40 seconds.
An architect’s manifesto on how teams can rethink the design of baseball stadiums:
Fans want to feel that the club has bought into them, and a bolder model of...
✦
September 7, 2019 • #
This week’s links are all interactive notebooks on Observable. Their Explore section always highlights interesting things people are creating. A great learning tool for playing with data and code to see how it works.
Easily the most impressive interactive notebook I’ve ever seen. This one from Tom shows the electromechanical pathways of the German Enigma machine at work — enter a character and see how the rotors and circuits encrypt text.
Another great example of the power...
✦
August 4, 2019 • #
After a long ride today, I was looking at the stats on Strava and wondering how wattage calculations work to determine power. Strava has a built in estimate it uses for your power rating if you don’t have a power meter on your bike. From looking into it, their calculations look pretty sophisticated for estimating power pretty closely, unless you’re really riding in extreme conditions:
The power produced while riding is made up of several components:
- Power produced to overcome the rolling resistance of forward motion.
- Power produced to...
✦
July 29, 2019 • #
I use Fulcrum all the time for collecting data around hobbies of mine. Sometimes it’s for fun or interests, sometimes for mapping side projects, or even just for testing the product as we develop new features.
Here are a few of my key every day apps I use for personal tracking. I’m always tinkering around with other things as we expand the product, but each of these I’ve been using for years pretty consistently.
Gas Mileage
Of course there are apps out there devoted to this task, but I like the idea of having my own raw...
✦
June 15, 2019 • #
Paul Ramsey considers who might be in the best position to challenge Google as the next mapping company:
Someone is going to take another run at Google, they have to. My prediction is that it will be AWS, either through acquisition (Esri? Mapbox?) or just building from scratch. There is no doubt Amazon already has some spatial smarts, since they have to solve huge logistical problems in moving goods around for the retail side, problems that require spatial quality data...
✦
May 25, 2019 • #
In the era of every company trying to play in machine learning and AI technology, I thought this was a refreshing perspective on data as a defensible element of a competitive moat. There’s some good stuff here in clarifying the distinction between network effects and scale effects:
But for enterprise startups — which is where we focus — we now wonder if there’s practical evidence of data network effects at all. Moreover, we suspect that even the more straightforward data scale effect has limited...
✦
January 24, 2019 • #
The last several months I’ve been spending quite a bit of time working on this: our geospatial data and analytical product line called Foresight. We’ve been in this business dating back to 2000 in various forms and using the technologies of the era, but empowered by today’s technology, decision support tools, and the open source geo stack, it’s evolved to something novel and unmatched for our customers.
At its core it’s “data-as-a-service” designed to give customers the insights they need to do more, spend less, decide faster, and reduce their uncertainty, with a focus on international geospatial markets.
...
✦
January 5, 2019 • #
My colleagues Bill Dollins and Todd Pollard (the core of our data team), wrote this post detailing how we go from original ground-based data collection in Fulcrum through a data processing pipeline to deliver product to customers. A combination of PostGIS, Python tools, FME, Amazon RDS, and other custom QA tools get us from raw content to finished, analyst-ready GEOINT products.
The 518 coordinated flights operation, by 16 Northern California emergency responder agencies, is one of...
✦
January 4, 2019 • #
A frequent desire for Fulcrum customers is to maintain locally a version of the data they collect with our platform, in their database system of choice. With our export tool, it’s simple to pull out extracts in formats like CSV, shapefile, SQLite, and even PostGIS or GeoPackage. What this doesn’t allow, though, is an automatable way to keep a local version of data on your own server. You’d have to extract data manually on some schedule and append new stuff to existing tables you’ve already got.
A while back we built and...
✦
October 29, 2018 • #
I’ve been an avid user of Goodreads for tracking books for the last ten years. Tom MacWright wrote a post and a script utility last year to export and format items from Goodreads into pages that could work in a Jekyll site, like his and this one. On my profile I track more than just what I’m reading; I also log start and finish dates, ratings, reviews, and more. Getting a feed somewhere on the website would certainly be cool (I have a branch now with this in progress). On my way to...
✦
May 18, 2017 • #
LiDAR point cloud data for Washington, DC, is available for anyone to use on Amazon Simple Storage Service (Amazon S3). This dataset, managed by the District of Columbia’s Office of the Chief Technology Officer (OCTO), with the direction of OCTO’s Geographic Information System (GIS) program, contains tiled point cloud data for the entire District along with associated metadata.
This is a great move by the District to make high value open data available.
Ben Thompson...
✦
April 21, 2017 • #
Using Amazon’s Athena service, you can now interactively query OpenStreetMap data right from an interactive console. No need to use the complicated OSM API, this is pure SQL. I’ve taken a stab at building out a replica OSM database before and it’s a beast. The dataset now clocks in at 56 GB zipped. This post from Seth Fitzsimmons gives a great overview of what you can do with it:
Working with “the planet” (as the data archives are referred to) can be unwieldy. Because it contains data spanning the...
✦


