Coleman McCormick

Archive of posts with tag 'Openstreetmap'

Weekend Reading: Looking Glass Politics, Enrichment, and OSM Datasets

July 18, 2020 • #

🐇 Looking-Glass Politics

On private emotions being thrown into the public sphere:

People escape the Dunbar world for obvious reasons: life there appears prosaic and uninspiring. They find a digital interface and, like Alice in Through the Looking-Glass, enter a new realm that glitters with infinite possibilities. Suddenly, you can flicker like a spark between the digital and the real. The exhilarating sensation is that you have been taken to a high place and shown all the kingdoms of the world: “These can be yours, if. . . .” If your video goes viral. If you gain millions of followers. If you compose that devastating tweet that will drive Donald Trump from the White House. There is, however, an entrance fee. Personal identity must be discarded.

🏭 The Great Enrichment

Deirdre McCloskey on the boom of progress over the past 200 years:

The Great Enrichment came from human ingenuity emancipated. Ordinary people, emboldened by liberalism, ventured on extraordinary projects—the marine chronometer, the selective breeding of cotton seed, the band saw, a new chemistry—or merely ventured boldly to a new job, the New World, or going west, young man. And, crucially, the bold adventurers, in parallel with liberations in science, music, and geographical exploration, came to be tolerated and even commended by the rest of society, first in Holland in the 17th century and then in Britain in the 18th.

🗺 OSM-ready Data Sets

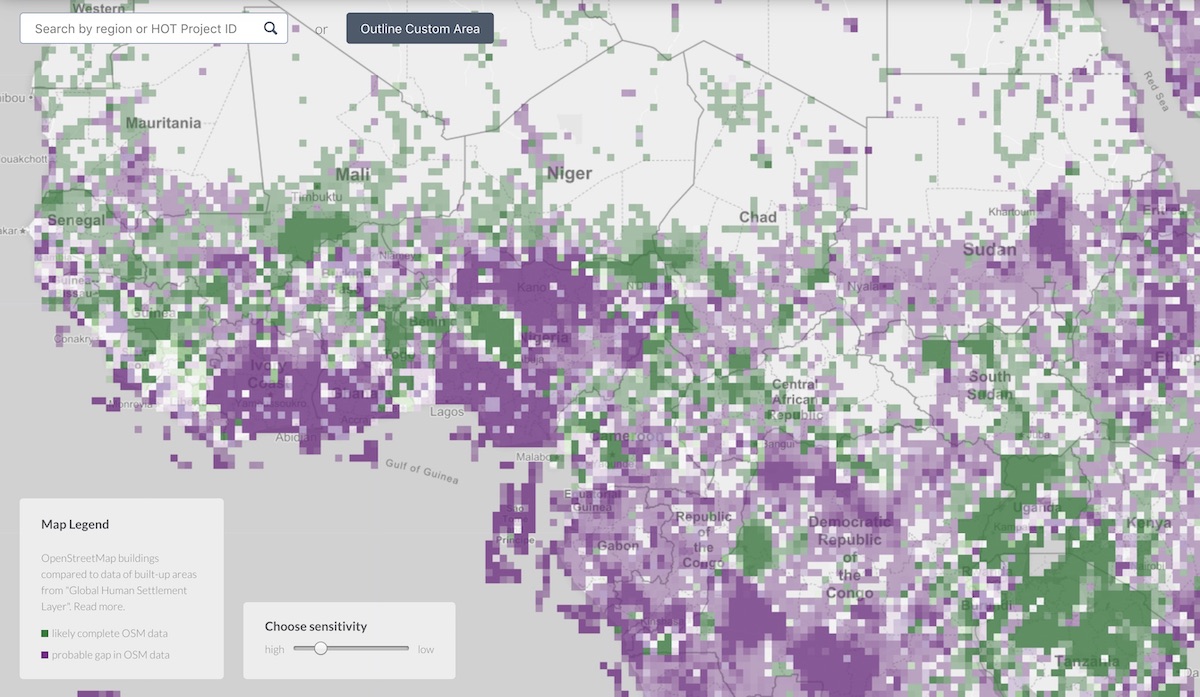
A partnership between Esri, Facebook, and the OpenStreetMap community to polish up and release datasets readily compatible with OSM (tagging and licensing).

Weekend Reading: Strasburg Tipping, RapiD, and TikTok Investigation

November 2, 2019 • #

⚾️ How the Nationals Fixed Stephen Strasburg and Saved Their Season

Strasburg tipping his pitches almost ended the Nats’ run:

He remembered the game Strasburg pitched in Arizona on August 3. The Diamondbacks pounded Strasburg for nine runs in less than five innings. The D-Backs knew what was coming. The Nationals broke down the tape and discovered Strasburg was tipping his pitches by the way he reached into his glove to grip the baseball near his waist, just before he raised his hands to the set position.

🗺 Mapping Remote Roads with OpenStreetMap, RapiD, and QGIS

An annotated version of Mike Migurski’s workshop on RapiD and Disaster Maps from the NetHope Summit. Facebook’s work on this stuff looks primed to change the way everyone is doing OpenStreetMap contribution.

📱 U.S. opens national security investigation into TikTok

I’ve never used TikTok, but it’s been a fascination tech story to follow its insane growth over the last 8-12 months. With the current geopolitical climate and the fact that it’s owned by Chinese owner ByteDance, it seemed like this CFIUS investigation was inevitable.

Weekend Reading: Summer Solstice, Zoom Learnings, and TeachOSM

July 6, 2019 • #

📺 5 Learnings from Zoom

Zoom is one of those admirable SaaS companies built on solid product and amazing execution. I love this — not relying on anything sexy or super inventive, just solving a known problem better than everyone else. My favorite bit is their retention; it proves what can be done even in SMB with lock-tight product market fit:

Zoom has 140% net revenue retention. This is similar to RingCentral from our last analysis and other leaders. Zoom also shows that yes, this can be done with smaller customers too, not just enterprises.

☀️ Visualizing the Summer Solstice

This is a great quick animation showing the sun’s path across the globe during the summer solstice. It shows very clearly why, as you move toward northern latitudes in the summer you get such long days, with perpetual sunlight above the Arctic Circle.

🧭 Training the Next Generation of Mappers

The TeachOSM crew has been doing grest work training teachers how to use OpenStreetMap in their classrooms. Geographic education is critical, especially in primary education, to form a baseline understanding of the world. I got to help out at one of these workshops last year and the outcomes were truly impressive.

Since 2016, TeachOSM has trained ~350 teachers and vocational educators in open mapping techniques. So giving open mapping workshops for teachers has become a staple of our programming over the last few years. In this post, I briefly outline what we do in our workshops, why it is vital work, and how you can help us to make OSM available in geography classes everywhere.

Weekend Reading: RoboSat, the State of Security, and the Equal Earth Map

January 12, 2019 • #

🛰 Buildings from Imagery with RoboSat

This excellent guide shows how to combine take imagery from OpenAerialMap and buildings from OpenStreetMap, and combine to train a model for automated feature extraction. It uses an open source tool from Mapbox called RoboSat combined to compare a GeoTIFF from OAM with a PBF extracts from OSM. Very cool to have a generalized tool for doing this with open data.

🔐 The State of Software Security in 2019

An excellent roundup (with tons of ancillary linked sources) on the state of various parts of computer security, from programming, to browsers, to social engineering.

🌍 The Equal Earth Map

From Tom Patterson, the Equal Earth map uses the equal earth projection to show countries with their true relative sizes. No more ginormous Russia or Africa-sized Greenland.

Video Mapping in OpenStreetMap with Fulcrum

December 16, 2018 • #

With tools like Mapillary and OpenStreetCam, it’s pretty easy now to collect street-level images with a smartphone for OpenStreetMap editing. Point of interest data is now the biggest quality gap for OSM as compared to other commercial map data providers. It’s hard to compete with the multi-billion dollar investments in street mapping and the bespoke equipment of Google or Apple. There’s promise for OSM to be a deep, current source of this level of detail, but it requires true mass-market crowdsourcing to get there.

The businesses behind platforms like Mapillary and OpenStreetCam aren’t primarily based on improving OSM. Though Telenav does build OSC as a means to contribute, their business is in automotive mapping powered by OSM, not the collection tool itself. Mapillary on the other hand is a computer vision technology company. They want data, so opening the content for OSM mapping attracts contributors.

I’ve been collecting street-level imagery for years using windshield mounts in my car, typically for my own purposes to add detail in OSM. Since we launched our SpatialVideo feature in Fulcrum (over 4 years ago now!), I’ve used that for most of my data collection. While the goals of that feature in Fulcrum are wider than just vehicle-based data capture, the GPS tracking data with SpatialVideo makes it easier to scrub through spatially to find what’s missing from the map. My personal workflow is usually centered on adding points of interest, but street furniture, power infrastructure, and signage are also present everywhere and typically unmapped. You can often see addresses on buildings, and I rarely find new area where the point of interest data is already rich. There’s so much to be filled in or updated.

This is a quick sample of what video looks like from my dash mount. It’s fairly stable, and the mounts are low-cost. This is the SV player in the Fulcrum Editor review tool:

One of the cool things about the Fulcrum format is that it’s video, so that smoothness can help make sure you’ve got each frame needed — particularly on high speed thoroughfares. We built in a feature to control the frame rate and resolution of the video recording, so what I do is maximize the resolution but drop the frame rate well below 30 fps. This helps tremendously to minimize the data quantity that’s got to get back to the server. Even 3 or 5 fps can be plenty for mapping purposes. I usually go with 10 or so just to smooth it out a little bit; the size doesn’t get too bad until you go past 15 or so.

Of course the downside is that this content isn’t available to the public easily for others to map from. Not a huge deal to me, but with Fulcrum Community we’re looking at some ways to open this system up to use for contribution, a la Mapillary or OSC.

Weekend Reading: Exploring Zanzibar, Singapore of the Future, & Watching Basketball

December 1, 2018 • #

🇹🇿 Exploring Zanzibar with Mapillary

A fun travel post from the Mapillary team after FOSS4G in Dar es Salaam. A drive around Zanzibar collecting images for OpenStreetMap mapping. Also check out part 2 of the journey.

🇸🇬 City of the Future: Singapore

Singapore is an interesting experiment: a benevolent authoritarian government, small population, and limited geography to leverage and nurture. This documentary is a bit of a commercial for their plans for the future. Still some fun ideas that (if successful) other megacities could use to maintain quality of life with population growth.

🏀 How to Watch Basketball

This was a great explainer. I’ve only been seriously watching basketball a couple of years, and I was starting to figure out some of these techniques myself. It’s interesting to see how coaches and professional analysts approach watching a game.

OpenStreetMap and TeachOSM

November 15, 2018 • #

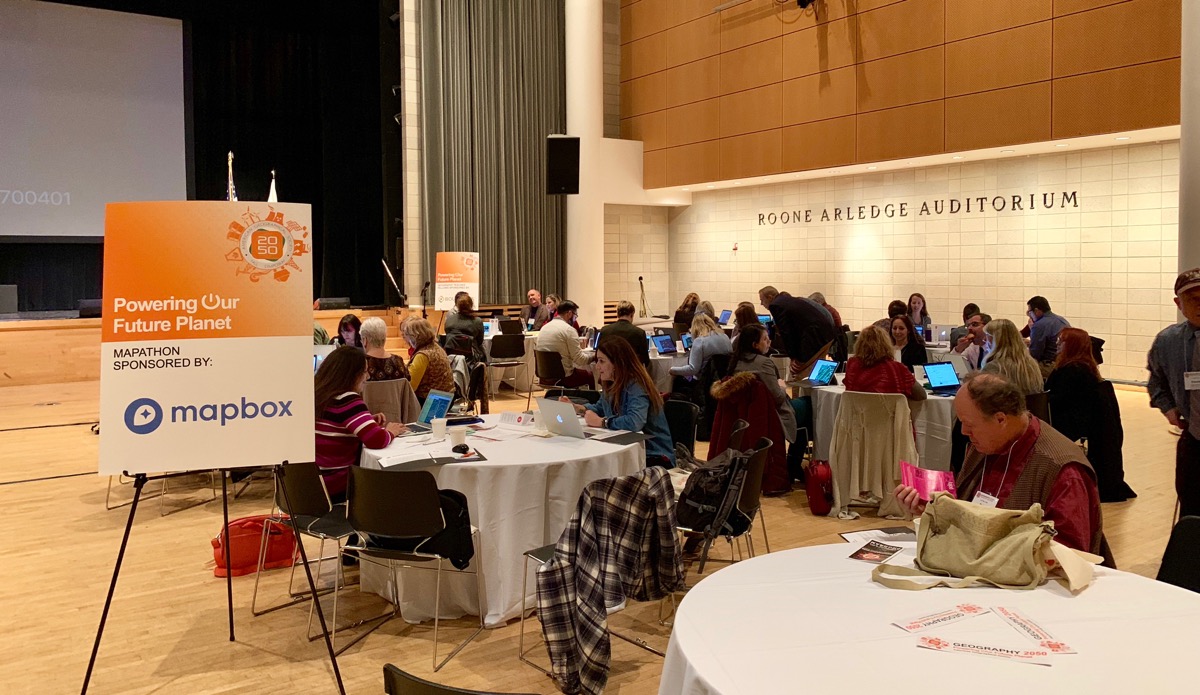
I’ve hosted many OSM mapathons in the past, and today’s event with AGS and the Geo2050 conference was a huge success. It’s hard to create an engaging, productive environment that’s conducive to new mappers learning about OpenStreetMap. Today’s objective was to highlight how teachers can involve students in active work + contribution in a valuable context.

TeachOSM mapathon

Steve, Richard, and Nuala did all the work, I just showed up to lend advice to folks that had any questions while mapping. The TeachOSM group did an excellent job showing the tasking manager, with a couple of challenge tasks to get folks comfortable with learning the editor and basic mapping.

One of the teachers told me that her students are often asking how they can contribute or give back in response to those in need around the world. They collect donations of money and food, among other things. She was ecstatic to learn that HOTOSM’s tasking manager offers up a plethora of real opportunities to respond to active needs, and learn about new places around the world while also giving back.

This is what has always motivated me most with doing OSM mapping — using it to get people interested in maps and geography. I’ve always maintained that the missing element in growing the OSM community is getting people to care. Most people think it’s neat at first glance, but don’t quite see the benefit in where their contributions will ever get used. Today I think we successfully demonstrated the benefits to over 50 people who are now armed to evangelize OpenStreetMap with their student networks.

Teaching OpenStreetMap

October 26, 2018 • #

We’re heading up next month to the American Geographical Society’s Geography2050 again this year, which will be my 4th one, and the 5th annual overall. It’s always a great event — a diverse crowd in attendance and a chance to catch up with a lot of old friends.

The last two years the AGS has hosted and led an OpenStreetMap mapathon in conjunction with the event to promote OSM as a tool in education. It’s organized and led by TeachOSM, and they invite 50+ AP Geography teachers from around the country to learn how to work with OpenStreetMap in their classrooms as a teaching aid. Alongside Steven Johnson and Richard Hinton (who do the real work behind TeachOSM), I’ll be helping out as a volunteer to lend my knowledge of OSM and its editing tools to the group.

I’ve always been a JOSM power user (like CAD for mapping), but I’m sure for this exercise we’ll do things with the built-in editor, iD, and maybe some HOTOSM mapping tasks for aid work. I’ll need to brush up on the latest and greatest with iD. I follow the project on GitHub and have seen tons of activity going on lately.

It’s been a long time since I’ve done anything in OSM at all, especially in a mapathon group setting. It’ll be a refreshing opportunity to get to do some mapping again and to support such a great cause to promote geography education.

Weekly Links: OSM on AWS, Fulcrum Editor, & Real-time Drone Maps

April 21, 2017 • #

Querying OpenStreetMap with Amazon Athena 🗺

Using Amazon’s Athena service, you can now interactively query OpenStreetMap data right from an interactive console. No need to use the complicated OSM API, this is pure SQL. I’ve taken a stab at building out a replica OSM database before and it’s a beast. The dataset now clocks in at 56 GB zipped. This post from Seth Fitzsimmons gives a great overview of what you can do with it:

Working with “the planet” (as the data archives are referred to) can be unwieldy. Because it contains data spanning the entire world, the size of a single archive is on the order of 50 GB. The format is bespoke and extremely specific to OSM. The data is incredibly rich, interesting, and useful, but the size, format, and tooling can often make it very difficult to even start the process of asking complex questions.

Heavy users of OSM data typically download the raw data and import it into their own systems, tailored for their individual use cases, such as map rendering, driving directions, or general analysis. Now that OSM data is available in the Apache ORC format on Amazon S3, it’s possible to query the data using Athena without even downloading it.

Introducing the New Fulcrum Editor 🔺

Personal plug here, this is something that’s been in the works for months. We just launched Editor, the completely overhauled data editing toolset in Fulcrum. I can’t wait for the follow up post to explain the nuts and bolts of how this is put together. The power and flexibility is truly amazing.

Real-time Drone Mapping with FieldScanner 🚁

The team at DroneDeploy just launched the first live aerial imagery product for drones. Pilots can now fly imagery and get a live, processed, mosaicked result right on a tablet immediately when their mission is completed. This is truly next level stuff for the burgeoning drone market:

The poor connectivity and slow internet speeds that have long posed a challenge for mapping in remote areas don’t hamper Fieldscanner. Designed for use the fields, Fieldscanner can operate entirely offline, with no need for cellular or data coverage. Fieldscanner uses DroneDeploy’s existing automatic flight planning for DJI drones and adds local processing on the drone and mobile device to create a low-resolution Fieldscan as the drone is flying, instead of requiring you to process imagery into a map at a computer after the flight.

Bringing Geographic Data Into the Open with OpenStreetMap

September 9, 2013 • #

This is an essay I wrote that was published in the OpenForum Academy’s “Thoughts on Open Innovation” book in early summer 2013. Shane Coughlan invited me to contribute on open innovation in geographic data, so I wrote this piece on OpenStreetMap and its implications for community-building, citizen engagement, and transparency in mapping. Enjoy.
OpenStreetMapWith the growth of the open data movement, governments and data publishers are looking to enhance citizen participation. OpenStreetMap, the wiki of world maps, is an exemplary model for how to build community and engagement around map data. Lessons can be learned from the OSM model, but there are many places where OpenStreetMap might be the place for geodata to take on a life of its own.

The open data movement has grown in leaps and bounds over the last decade. With the expansion of the Internet, and spurred on by things like Wikipedia, SourceForge, and Creative Commons licenses, there’s an ever-growing expectation that information be free. Some governments are rushing to meet this demand, and have become accustomed to making data open to citizens: policy documents, tax records, parcel databases, and the like. Granted, the prevalence of open information policies is far from universal, but the rate of growth of government open data is only increasing. In the world of commercial business, the encyclopedia industry has been obliterated by the success of Wikipedia, thanks to the world’s subject matter experts having an open knowledge platform. And GitHub’s meteoric growth over the last couple of years is challenging how software companies view open source, convincing many to open source their code to leverage the power of software communities. Openness and collaborative technologies are on an unceasing forward march.

In the context of geographic data, producers struggle to understand the benefits of openness, and how to achieve the same successes enjoyed by other open source initiatives within the geospatial realm. When assessing the risk-reward of making data open, it’s easy to identify reasons to keep it private (How is security handled? What about updates? Liability issues?), and difficult to quantify potential gains. As with open sourcing software, it takes a mental shift on the part of the owner to redefine the notion of “ownership” of the data. In the open source software world, proprietors of a project can often be thought of more as “stewards” than owners. They aren’t looking to secure the exclusive rights to the access and usage of a piece of code for themselves, but merely to guide the direction of its development in a way that suits project objectives. Map data published through online portals is great, and is the first step to openness. But this still leaves an air gap between the data provider and the community. Closing this engagement loop is key to bringing open geodata to the same level of genuine growth and engagement that’s been achieved by Wikipedia.

An innovative new approach to open geographic data is taking place today with the OpenStreetMap project. OpenStreetMap is an effort to build a free and open map of the entire world, created from user contributions – to do for maps what Wikipedia has done for the encyclopedia. Anyone can login and edit the map – everything from business locations and street names to bus networks, address data, and routing information. It began with the simple notion that if I map my street and you map your street, then we share data, both of us have a better map. Since its founding in 2004 by Steve Coast, the project has reached over 1 million registered users (nearly doubling in the last year), with tens of thousands of edits every day. Hundreds of gigabytes of data now reside in the OpenStreetMap database, all open and freely available. Commercial companies like MapQuest, Foursquare, MapBox, Flickr, and others are using OpenStreetMap data as the mapping provider for their platforms and services. Wikipedia is even using OpenStreetMap as the map source in their mobile app, as well as for many maps within wiki articles.

What OpenStreetMap is bringing to the table that other open data initiatives have struggled with is the ability to incorporate user contribution, and even more importantly, to invite engagement and a sense of co-ownership on the part of the contributor. With OpenStreetMap, no individual party is responsible for the data, everyone is. In the Wikipedia ecosystem, active editors tend to act as shepherds or monitors of articles to which they’ve heavily contributed. OpenStreetMap creates this same sense of responsibility for editors based on geography. If an active user maps his or her entire neighborhood, the feeling of ownership is greater, and the user is more likely to keep it up to date and accurate.

Open sources of map data are not new. Government departments from countries around the world have made their maps available for free for years, dating back to paper maps in libraries – certainly a great thing from a policy perspective that these organizations place value on transparency and availability of information. The US Census Bureau publishes a dataset of boundaries, roads, and address info in the public domain (TIGER). The UK’s Ordnance Survey has published a catalog of open geospatial data through their website. GeoNames.org houses a database of almost ten million geolocated place names. There are countless others, ranging from small, city-scale databases to entire country map layers. Many of these open datasets have even made their way into OpenStreetMap in the form imports, in which the OSM community occasionally imports baseline data for large areas based on pre-existing data available under a compatible license. In fact, much of the street data present in the United States data was imported several years ago from the aforementioned US Census TIGER dataset.

Open geodata sources are phenomenal for transparency and communication, but still lack the living, breathing nature of Wikipedia articles and GitHub repositories. “Crowdsourcing” has become the buzzword with public agencies looking to invite this type of engagement in mapping projects, to widely varying degrees of success. Feedback loops with providers of open datasets typically consist of “report an issue” style funnels, lacking the ability for direct interaction from the end user. By allowing the end user to become the creator, it instills a sense of ownership and responsibility for quality. As a contributor, I’m left to wonder about my change request. “Did they even see my report that the data is out of date in this location? When will it be updated or fixed?” The arduous task of building a free map of the entire globe wouldn’t even be possible without inviting the consumer back in to create and modify the data themselves.

Enabling this combination of contribution and engagement for OpenStreetMap is an impressive stack of technology that powers the system, all driven by a mesh of interacting open source software projects under the hood. This suite of tools that drives the database, makes it editable, tracks changes, and publishes extracted datasets for easy consumption is produced by a small army of volunteer software developers collaborating to power the OpenStreetMap engine. While building this software stack is not the primary objective of OSM, it’s this that makes becoming a “mapper” possible. There are numerous editing tools available to contributors, ranging from the very simple for making small corrections, to the power tools for mass editing by experts. This narrowing of the technical gap between data and user allows the novice to make meaningful contribution and feel rewarded for taking part. Wikipedia would not be much today without the simplicity of clicking a single “edit” button. There’s room for much improvement here for OpenStreetMap, as with most collaboration-driven projects, and month-by-month the developer community narrows this technical gap with improvements to contributor tools.

In many ways, the roadblocks to adoption of open models for creating and distributing geodata aren’t ones of policy, but of technology and implementation. Even with ostensibly “open data” available through a government website, data portals are historically bad at giving citizens the tools to get their hands around that data. In the geodata publishing space, the variety of themes, file sizes, and different data formats combine to complicate the process of making the data conveniently available to users. What good is a database I’m theoretically allowed to have a copy of when it’s in hundreds of pieces scattered over a dozen servers? “Permission” and “accessibility” are different things, and both critical aspects to successful open initiatives. A logical extension of opening data, is opening access to that data. If transparency, accountability, and usability are primary drivers for opening up maps and data, lowering the bar for access is critical to make those a reality.

A great example the power of the engagement feedback loop with OpenStreetMap is the work of the Humanitarian OpenStreetMap Team’s (HOT) work over the past few years. HOT kicked off in 2009 to coordinate the resources resident in the OpenStreetMap community and apply them to assist with humanitarian aid projects. Working both remotely and on the ground, the first large scale effort undertaken by HOT was mapping in response to the Haiti earthquake in early 2010. Since then, HOT has grown its contributor base into the hundreds, and has connected with dozens of governments and NGOs worldwide—such as UNOCHA, UNOSAT, and the World Bank—to promote open data, sharing, transparency, and collaboration to assist in the response to humanitarian crises. To see the value of their work, you need look no further than the many examples showing OpenStreetMap data for the city of Port-au-Prince, Haiti before and after the earthquake. In recent months, HOT has activated to help with open mapping initiatives in Indonesia, Senegal, Congo, Somalia, Pakistan, Mali, Syria, and others.

One of the most exciting things about HOT, aside from the fantastic work they’ve facilitated in the last few years, is that it provides a tangible example for why engagement is such a critical component to organic growth of open data initiatives. The OpenStreetMap contributor base, which now numbers in the hundreds of thousands, can be mobilized for volunteer contribution to map places where that information is lacking, and where it has a direct effect on the capabilities of aid organizations working in the field. With a traditional, top-down managed open data effort, the response time would be too long to make immediate use of the data in crisis.

Another unspoken benefit to the OpenStreetMap model for accepting contributions from a crowd is the fact that hyperlocal map data benefits most from local knowledge. There’s a strong desire for this sort of local reporting on facts and features on the ground all over the world, and the structure of OpenStreetMap and its user community suits this quite naturally. Mappers tend to map things nearby, things they know. Whether it’s a mapper in a rural part of the western United States, a resort town in Mexico, or a flood-prone region in Northern India, there’s always a consumer for local information, and often times from those for whom it’s prohibitively expensive to acquire. In addition to the expertise of local residents contributing to the quality of available data, we also have local perspective that can be interesting, as well. This can be particularly essential to those humanitarian crises, as there’s a tendency for users to map things that they perceive as higher in importance to the local community.

Of course OpenStreetMap isn’t a panacea to all geospatial data needs. There are many requirements for mapping, data issue reporting, and opening of information where the data is best suited to more centralized control. Data for things like electric utilities, telecommunications, traffic routing, and the like, while sometimes publishable to a wide audience, still have service dependencies that require centralized, authoritative management. Even with data that requires consolidated control by a government agency or department, though, the principles of engagement and short feedback loops present in the OpenStreetMap model could still be applied, at least in part. Regardless of the model, getting the most out of an open access data project requires an ability for a contributor to see the effect of their contribution, whether it’s an edit to a Wikipedia page, or correcting a one way street on a map.

With geodata, openness and accessibility enable a level of conversation and direct interaction between publishers and contributors that has never been possible with traditional unilateral data sharing methods. OpenStreetMap provides a mature and real-world example of why engagement is often that missing link in the success of open initiatives.

The complete book is available as a free PDF download, or you can buy a print copy here.
Creating New Contributors to OpenStreetMap

January 15, 2013 • #

I wrote a blog post last week about the first few months of usage of Pushpin, the mobile app we built for editing OpenStreetMap data.

As I mentioned in the post, I’m fascinated and excited by how many brand new OpenStreetMap users we’re creating, and how many who never edited before are taking an interest in making contributions. This has been an historic problem for the OpenStreetMap project for years now: How do you convince a casually-interested person to invest the time to learn how to contribute themselves?

There are two primary hurdles I’ve always seen with why “interested users” don’t make contributions; one technical, and one more philosophical:

  1. Editing map data is somewhat complicated, and the documentation and tools don’t help many users to climb over this hump.
  2. It’s hard to answer the question: “Why should I edit this map? What am I editing, and who benefits from the information?”

To the first point, this is an issue largely of time and effort on the part of the volunteer-led developer community behind OpenStreetMap. GIS data is fundamentally complex, much moreso than Wikipedia’s content, the primary analog to which OpenStreetMap is often compared—“Wikipedia for maps”. It’s an apt comparison only on a conceptual level, but when it comes time to build an editor for the information within each system, the demands of OpenStreetMap data take the complexity to another level. As I said, the community is constantly chewing this issue, and making amazing progress on a new web-based editor. In building Pushpin, we spent a long time making sure that the user didn’t need to know anything about the complex OpenStreetMap tagging system in order to make edits. We picked apart the wiki and taginfo to abstract the common tags into simple picklists, which prevents both the need to type lots of info, and the need to know that amenity=place_of_worship is the proper tag for a church or mosque.

As for answering the “why”, that’s a little more complicated. People contribute to community projects for a host of reasons, so it’s a challenge to nail down how this should be communicated about OSM. There are stray bits around that tell the story pretty succinctly, but the problem lies in centralizing that core message. The LearnOSM site does a good job of explaining to a non-expert what the benefits are of becoming part of the contributor community, but it feels like the story needs to be told somewhere closer to the main homepage. Alex Barth recently proposed an excellent idea to the OpenStreetMap mailing list, a “contributors mark” that can be used within OSM-based services to convey the value of free and open map data. This is an excellent idea that addresses a couple of needs. For one it communicates what the project actually is, rather than just sending the unsuspecting user to a page about ODbL, and it also gives a general sense of how the data is used by real people.

In order for those one million user accounts to turn into one million contributors, we need to do a better job at conveying the meaning of the project and the value it provides to OpenStreetMap’s thousands of data consumers.